mne.time_frequency.CrossSpectralDensity#
- class mne.time_frequency.CrossSpectralDensity(data, ch_names, frequencies, n_fft, tmin=None, tmax=None, projs=None)[source]#
Cross-spectral density.
Given a list of time series, the CSD matrix denotes for each pair of time series, the cross-spectral density. This matrix is symmetric and internally stored as a vector.
This object can store multiple CSD matrices: one for each frequency. Use
.get_data(freq)to obtain an CSD matrix as an ndarray.- Parameters:
- data
ndarray, shape ((n_channels**2 + n_channels) // 2, n_frequencies) For each frequency, the cross-spectral density matrix in vector format.
- ch_names
listofstr List of string names for each channel.
- frequencies
float|listoffloat|listoflistoffloat Frequency or frequencies for which the CSD matrix was calculated. When averaging across frequencies (see the
CrossSpectralDensity.mean()function), this will be a list of lists that contains for each frequency bin, the frequencies that were averaged. Frequencies should always be sorted.- n_fft
int The number of FFT points or samples that have been used in the computation of this CSD.
- tmin
float|None Start of the time window for which CSD was calculated in seconds. Can be
None(the default) to indicate no timing information is available.- tmax
float|None End of the time window for which CSD was calculated in seconds. Can be
None(the default) to indicate no timing information is available.- projs
listofProjection|None List of projectors to apply to timeseries data when using this CSD object to compute a DICS beamformer. Defaults to
None, which means no projectors will be applied.
- data
- Attributes:
n_channelsNumber of time series defined in this CSD object.
Methods
__getitem__(sel)Subselect frequencies.
__len__()Return number of frequencies.
copy()Return copy of the CrossSpectralDensity object.
get_data([frequency, index, as_cov])Get the CSD matrix for a given frequency as NumPy array.
mean([fmin, fmax])Calculate the mean CSD in the given frequency range(s).
pick_channels(ch_names[, ordered])Pick channels from this cross-spectral density matrix.
pick_frequency([freq, index])Get a CrossSpectralDensity object with only the given frequency.
plot([info, mode, colorbar, cmap, n_cols, show])Plot CSD matrices.
save(fname, *[, overwrite, verbose])Save the CSD to an HDF5 file.
sum([fmin, fmax])Calculate the sum CSD in the given frequency range(s).
See also
- __getitem__(sel)[source]#
Subselect frequencies.
- Parameters:
- sel
ndarray Array of frequency indices to subselect.
- sel
- Returns:
- csdinstance of
CrossSpectralDensity A new CSD instance with the subset of frequencies.
- csdinstance of
- copy()[source]#
Return copy of the CrossSpectralDensity object.
- Returns:
- copyinstance of
CrossSpectralDensity A copy of the object.
- copyinstance of
- get_data(frequency=None, index=None, as_cov=False)[source]#
Get the CSD matrix for a given frequency as NumPy array.
If there is only one matrix defined in the CSD object, calling this method without any parameters will return it. If multiple matrices are defined, use either the
frequencyorindexparameter to select one.- Parameters:
- frequency
float|None Return the CSD matrix for a specific frequency. Only available when no averaging across frequencies has been done.
- index
int|None Return the CSD matrix for the frequency or frequency-bin with the given index.
- as_covbool
Whether to return the data as a numpy array (
False, the default), or pack it in amne.Covarianceobject (True).New in v0.20.
- frequency
- Returns:
- csd
ndarray, shape (n_channels, n_channels) | instance ofCovariance The CSD matrix corresponding to the requested frequency.
- csd
See also
- mean(fmin=None, fmax=None)[source]#
Calculate the mean CSD in the given frequency range(s).
- Parameters:
- fmin
float|listoffloat|None Lower bound of the frequency range in Hertz. Defaults to the lowest frequency available. When a list of frequencies is given, these are used as the lower bounds (inclusive) of frequency bins and the mean is taken for each bin.
- fmax
float|listoffloat|None Upper bound of the frequency range in Hertz. Defaults to the highest frequency available. When a list of frequencies is given, these are used as the upper bounds (inclusive) of frequency bins and the mean is taken for each bin.
- fmin
- Returns:
- csdinstance of
CrossSpectralDensity The CSD matrix, averaged across the given frequency range(s).
- csdinstance of
Examples using
mean:
- property n_channels#
Number of time series defined in this CSD object.
- pick_channels(ch_names, ordered=False)[source]#
Pick channels from this cross-spectral density matrix.
- Parameters:
- Returns:
- csdinstance of CrossSpectralDensity.
The modified cross-spectral density object.
Notes
Operates in-place.
New in v0.20.0.
- pick_frequency(freq=None, index=None)[source]#
Get a CrossSpectralDensity object with only the given frequency.
- Parameters:
- Returns:
- csdinstance of
CrossSpectralDensity A CSD object containing a single CSD matrix that corresponds to the requested frequency or frequency-bin.
- csdinstance of
See also
- plot(info=None, mode='csd', colorbar=True, cmap='viridis', n_cols=None, show=True)[source]#
Plot CSD matrices.
A sub-plot is created for each frequency. If an info object is passed to the function, different channel types are plotted in different figures.
- Parameters:
- info
mne.Info|None The
mne.Infoobject with information about the sensors and methods of measurement. Used to split the figure by channel-type, if provided. By default, the CSD matrix is plotted as a whole.- mode‘csd’ | ‘coh’
Whether to plot the cross-spectral density (‘csd’, the default), or the coherence (‘coh’) between the channels.
- colorbarbool
Whether to show a colorbar. Defaults to
True.- cmap
str|None The matplotlib colormap to use. Defaults to None, which means the colormap will default to matplotlib’s default.
- n_cols
int|None CSD matrices are plotted in a grid. This parameter controls how many matrix to plot side by side before starting a new row. By default, a number will be chosen to make the grid as square as possible.
- showbool
Whether to show the figure. Defaults to
True.
- info
- Returns:
- save(fname, *, overwrite=False, verbose=None)[source]#
Save the CSD to an HDF5 file.
- Parameters:
- fnamepath-like
The name of the file to save the CSD to. The extension
'.h5'will be appended if the given filename doesn’t have it already.- overwritebool
If True (default False), overwrite the destination file if it exists.
New in v1.0.
- verbosebool |
str|int|None Control verbosity of the logging output. If
None, use the default verbosity level. See the logging documentation andmne.verbose()for details. Should only be passed as a keyword argument.New in v1.0.
See also
read_csdFor reading CSD objects from a file.
- sum(fmin=None, fmax=None)[source]#
Calculate the sum CSD in the given frequency range(s).
If the exact given frequencies are not available, the nearest frequencies will be chosen.
- Parameters:
- fmin
float|listoffloat|None Lower bound of the frequency range in Hertz. Defaults to the lowest frequency available. When a list of frequencies is given, these are used as the lower bounds (inclusive) of frequency bins and the sum is taken for each bin.
- fmax
float|listoffloat|None Upper bound of the frequency range in Hertz. Defaults to the highest frequency available. When a list of frequencies is given, these are used as the upper bounds (inclusive) of frequency bins and the sum is taken for each bin.
- fmin
- Returns:
- csdinstance of
CrossSpectralDensity The CSD matrix, summed across the given frequency range(s).
- csdinstance of
Examples using mne.time_frequency.CrossSpectralDensity#
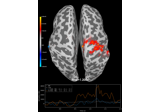
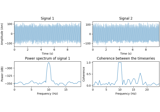
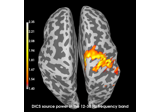
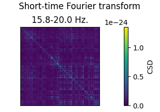
Compute source level time-frequency timecourses using a DICS beamformer