mne.viz.plot_snr_estimate#
- mne.viz.plot_snr_estimate(evoked, inv, show=True, axes=None, verbose=None)[source]#
Plot a data SNR estimate.
- Parameters:
- evokedinstance of
Evoked The evoked instance. This should probably be baseline-corrected.
- invinstance of
InverseOperator The minimum-norm inverse operator.
- showbool
Show figure if True.
- axesinstance of
Axes|None The axes to plot into.
New in v0.21.0.
- verbosebool |
str|int|None Control verbosity of the logging output. If
None, use the default verbosity level. See the logging documentation andmne.verbose()for details. Should only be passed as a keyword argument.
- evokedinstance of
- Returns:
- figinstance of
matplotlib.figure.Figure The figure object containing the plot.
- figinstance of
Notes
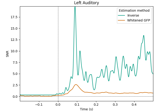
The bluish green line is the SNR determined by the GFP of the whitened evoked data. The orange line is the SNR estimated based on the mismatch between the data and the data re-estimated from the regularized inverse.
New in v0.9.0.