Note
Go to the end to download the full example code.
Sleep stage classification from polysomnography (PSG) data#
Note
This code is taken from the analysis code used in [1]. If you reuse this code please consider citing this work.
This tutorial explains how to perform a toy polysomnography analysis that answers the following question:
Important
Given two subjects from the Sleep Physionet dataset [2][3], namely Alice and Bob, how well can we predict the sleep stages of Bob from Alice’s data?
This problem is tackled as supervised multiclass classification task. The aim is to predict the sleep stage from 5 possible stages for each chunk of 30 seconds of data.
# Authors: Alexandre Gramfort <alexandre.gramfort@inria.fr>
#          Stanislas Chambon <stan.chambon@gmail.com>
#          Joan Massich <mailsik@gmail.com>
#
# License: BSD-3-Clause
# Copyright the MNE-Python contributors.
import matplotlib.pyplot as plt
import numpy as np
from sklearn.ensemble import RandomForestClassifier
from sklearn.metrics import accuracy_score, classification_report, confusion_matrix
from sklearn.pipeline import make_pipeline
from sklearn.preprocessing import FunctionTransformer

import mne
from mne.datasets.sleep_physionet.age import fetch_data
Load the data#
Here we download the data of two subjects. The end goal is to obtain epochs and the associated ground truth.
MNE-Python provides us with
mne.datasets.sleep_physionet.age.fetch_data() to conveniently download
data from the Sleep Physionet dataset
[2][3].
Given a list of subjects and records, the fetcher downloads the data and
provides us with a pair of files for each subject:
-PSG.edfcontaining the polysomnography. The raw data from the EEG helmet,-Hypnogram.edfcontaining the annotations recorded by an expert.
Combining these two in a mne.io.Raw object will allow us to extract
events based on the descriptions of the annotations to obtain the
epochs.
Read the PSG data and Hypnograms to create a raw object#
ALICE, BOB = 0, 1
[alice_files, bob_files] = fetch_data(subjects=[ALICE, BOB], recording=[1])
raw_train = mne.io.read_raw_edf(
alice_files[0],
stim_channel="Event marker",
infer_types=True,
preload=True,
verbose="error", # ignore issues with stored filter settings
)
annot_train = mne.read_annotations(alice_files[1])
raw_train.set_annotations(annot_train, emit_warning=False)
# plot some data
# scalings were chosen manually to allow for simultaneous visualization of
# different channel types in this specific dataset
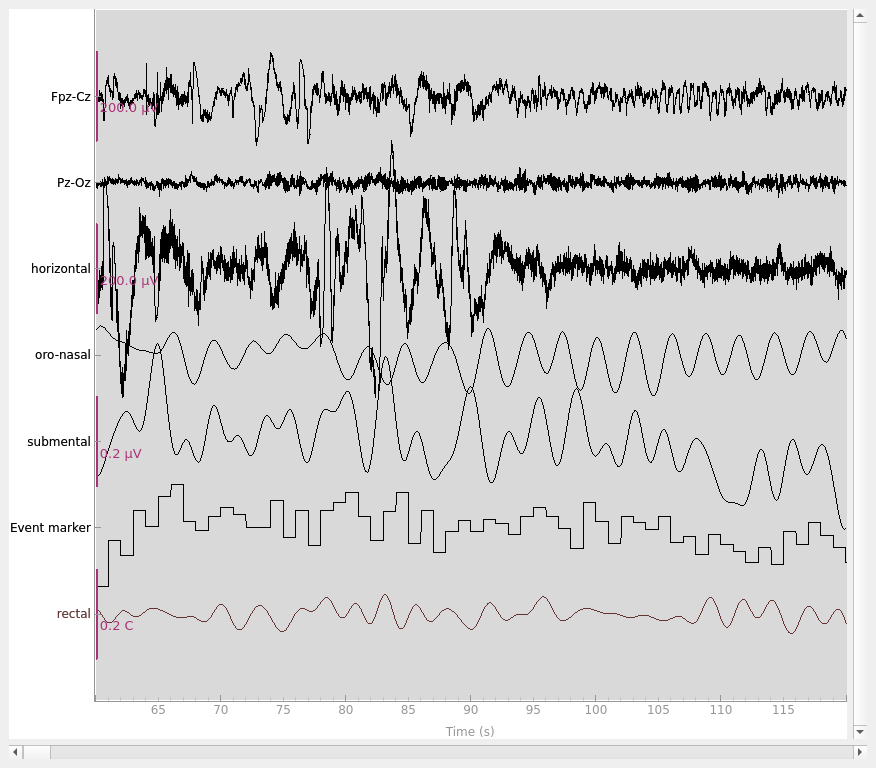
raw_train.plot(
start=60,
duration=60,
scalings=dict(eeg=1e-4, resp=1e3, eog=1e-4, emg=1e-7, misc=1e-1),
)
Using default location ~/mne_data for PHYSIONET_SLEEP...
Using qt as 2D backend.
Extract 30s events from annotations#
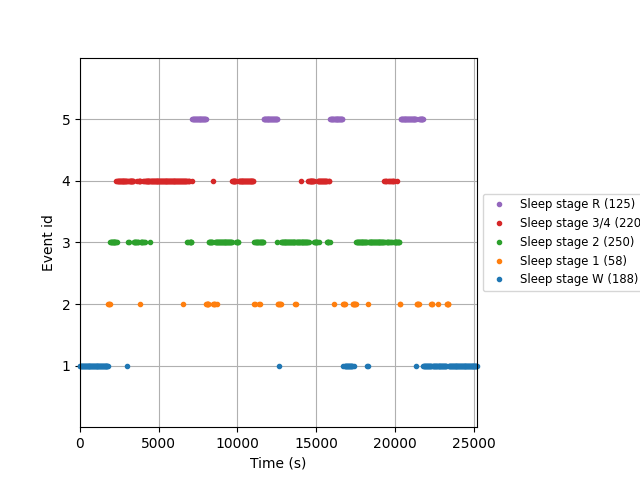
The Sleep Physionet dataset is annotated using 8 labels: Wake (W), Stage 1, Stage 2, Stage 3, Stage 4 corresponding to the range from light sleep to deep sleep, REM sleep (R) where REM is the abbreviation for Rapid Eye Movement sleep, movement (M), and Stage (?) for any none scored segment.
We will work only with 5 stages: Wake (W), Stage 1, Stage 2, Stage 3/4, and
REM sleep (R). To do so, we use the event_id parameter in
mne.events_from_annotations() to select which events are we
interested in and we associate an event identifier to each of them.
Moreover, the recordings contain long awake (W) regions before and after each night. To limit the impact of class imbalance, we trim each recording by only keeping 30 minutes of wake time before the first occurrence and 30 minutes after the last occurrence of sleep stages.
annotation_desc_2_event_id = {
    "Sleep stage W": 1,
    "Sleep stage 1": 2,
    "Sleep stage 2": 3,
    "Sleep stage 3": 4,
    "Sleep stage 4": 4,
    "Sleep stage R": 5,
}

# keep last 30-min wake events before sleep and first 30-min wake events after
# sleep and redefine annotations on raw data
annot_train.crop(annot_train[1]["onset"] - 30 * 60, annot_train[-2]["onset"] + 30 * 60)
raw_train.set_annotations(annot_train, emit_warning=False)

events_train, _ = mne.events_from_annotations(
    raw_train, event_id=annotation_desc_2_event_id, chunk_duration=30.0
)

# create a new event_id that unifies stages 3 and 4
event_id = {
    "Sleep stage W": 1,
    "Sleep stage 1": 2,
    "Sleep stage 2": 3,
    "Sleep stage 3/4": 4,
    "Sleep stage R": 5,
}

# plot events
fig = mne.viz.plot_events(
    events_train,
    event_id=event_id,
    sfreq=raw_train.info["sfreq"],
    first_samp=events_train[0, 0],
)

# keep the color-code for further plotting
stage_colors = plt.rcParams["axes.prop_cycle"].by_key()["color"]
Used Annotations descriptions: [np.str_('Sleep stage 1'), np.str_('Sleep stage 2'), np.str_('Sleep stage 3'), np.str_('Sleep stage 4'), np.str_('Sleep stage R'), np.str_('Sleep stage W')]
Create Epochs from the data based on the events found in the annotations#
tmax = 30.0 - 1.0 / raw_train.info["sfreq"]  # tmax in included

epochs_train = mne.Epochs(
    raw=raw_train,
    events=events_train,
    event_id=event_id,
    tmin=0.0,
    tmax=tmax,
    baseline=None,
)
del raw_train

print(epochs_train)
Not setting metadata
841 matching events found
No baseline correction applied
0 projection items activated
<Epochs | 841 events (good & bad), 0 – 29.99 s (baseline off), ~10 KiB, data not loaded,
 'Sleep stage W': 188
 'Sleep stage 1': 58
 'Sleep stage 2': 250
 'Sleep stage 3/4': 220
 'Sleep stage R': 125>
Applying the same steps to the test data from Bob#
raw_test = mne.io.read_raw_edf(
    bob_files[0],
    stim_channel="Event marker",
    infer_types=True,
    preload=True,
    verbose="error",
)
annot_test = mne.read_annotations(bob_files[1])
annot_test.crop(annot_test[1]["onset"] - 30 * 60, annot_test[-2]["onset"] + 30 * 60)
raw_test.set_annotations(annot_test, emit_warning=False)
events_test, _ = mne.events_from_annotations(
    raw_test, event_id=annotation_desc_2_event_id, chunk_duration=30.0
)
epochs_test = mne.Epochs(
    raw=raw_test,
    events=events_test,
    event_id=event_id,
    tmin=0.0,
    tmax=tmax,
    baseline=None,
)
del raw_test

print(epochs_test)
Used Annotations descriptions: [np.str_('Sleep stage 1'), np.str_('Sleep stage 2'), np.str_('Sleep stage 3'), np.str_('Sleep stage 4'), np.str_('Sleep stage R'), np.str_('Sleep stage W')]
Not setting metadata
1103 matching events found
No baseline correction applied
0 projection items activated
<Epochs | 1103 events (good & bad), 0 – 29.99 s (baseline off), ~10 KiB, data not loaded,
 'Sleep stage W': 157
 'Sleep stage 1': 109
 'Sleep stage 2': 562
 'Sleep stage 3/4': 105
 'Sleep stage R': 170>
Feature Engineering#
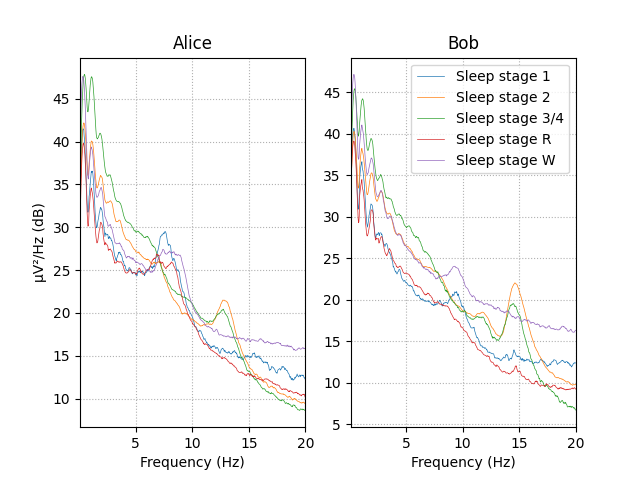
Observing the power spectral density (PSD) plot of the epochs grouped by sleeping stage we can see that different sleep stages have different signatures. These signatures remain similar between Alice and Bob’s data.
The rest of this section we will create EEG features based on relative power in specific frequency bands to capture this difference between the sleep stages in our data.
# visualize Alice vs. Bob PSD by sleep stage.
fig, (ax1, ax2) = plt.subplots(ncols=2)

# iterate over the subjects
stages = sorted(event_id.keys())
for ax, title, epochs in zip([ax1, ax2], ["Alice", "Bob"], [epochs_train, epochs_test]):
    for stage, color in zip(stages, stage_colors):
        spectrum = epochs[stage].compute_psd(fmin=0.1, fmax=20.0)
        spectrum.plot(
            ci=None,
            color=color,
            axes=ax,
            show=False,
            average=True,
            amplitude=False,
            spatial_colors=False,
            picks="data",
            exclude="bads",
        )
    ax.set(title=title, xlabel="Frequency (Hz)")
ax1.set(ylabel="µV²/Hz (dB)")
ax2.legend(ax2.lines[2::3], stages)
Using data from preloaded Raw for 58 events and 3000 original time points ...
0 bad epochs dropped
    Using multitaper spectrum estimation with 7 DPSS windows
Plotting power spectral density (dB=True).
Averaging across epochs before plotting...
Using data from preloaded Raw for 250 events and 3000 original time points ...
0 bad epochs dropped
    Using multitaper spectrum estimation with 7 DPSS windows
Plotting power spectral density (dB=True).
Averaging across epochs before plotting...
Using data from preloaded Raw for 220 events and 3000 original time points ...
0 bad epochs dropped
    Using multitaper spectrum estimation with 7 DPSS windows
Plotting power spectral density (dB=True).
Averaging across epochs before plotting...
Using data from preloaded Raw for 125 events and 3000 original time points ...
0 bad epochs dropped
    Using multitaper spectrum estimation with 7 DPSS windows
Plotting power spectral density (dB=True).
Averaging across epochs before plotting...
Using data from preloaded Raw for 188 events and 3000 original time points ...
0 bad epochs dropped
    Using multitaper spectrum estimation with 7 DPSS windows
Plotting power spectral density (dB=True).
Averaging across epochs before plotting...
Using data from preloaded Raw for 109 events and 3000 original time points ...
0 bad epochs dropped
    Using multitaper spectrum estimation with 7 DPSS windows
Plotting power spectral density (dB=True).
Averaging across epochs before plotting...
Using data from preloaded Raw for 562 events and 3000 original time points ...
0 bad epochs dropped
    Using multitaper spectrum estimation with 7 DPSS windows
Plotting power spectral density (dB=True).
Averaging across epochs before plotting...
Using data from preloaded Raw for 105 events and 3000 original time points ...
0 bad epochs dropped
    Using multitaper spectrum estimation with 7 DPSS windows
Plotting power spectral density (dB=True).
Averaging across epochs before plotting...
Using data from preloaded Raw for 170 events and 3000 original time points ...
0 bad epochs dropped
    Using multitaper spectrum estimation with 7 DPSS windows
Plotting power spectral density (dB=True).
Averaging across epochs before plotting...
Using data from preloaded Raw for 157 events and 3000 original time points ...
0 bad epochs dropped
    Using multitaper spectrum estimation with 7 DPSS windows
Plotting power spectral density (dB=True).
Averaging across epochs before plotting...
Design a scikit-learn transformer from a Python function#
We will now create a function to extract EEG features based on relative power in specific frequency bands to be able to predict sleep stages from EEG signals.
def eeg_power_band(epochs):
    """EEG relative power band feature extraction.

    This function takes an ``mne.Epochs`` object and creates EEG features based
    on relative power in specific frequency bands that are compatible with
    scikit-learn.

    Parameters
    ----------
    epochs : Epochs
        The data.

    Returns
    -------
    X : numpy array of shape [n_samples, 5 * n_channels]
        Transformed data.
    """
    # specific frequency bands
    FREQ_BANDS = {
        "delta": [0.5, 4.5],
        "theta": [4.5, 8.5],
        "alpha": [8.5, 11.5],
        "sigma": [11.5, 15.5],
        "beta": [15.5, 30],
    }

    spectrum = epochs.compute_psd(picks="eeg", fmin=0.5, fmax=30.0)
    psds, freqs = spectrum.get_data(return_freqs=True)
    # Normalize the PSDs
    psds /= np.sum(psds, axis=-1, keepdims=True)

    X = []
    for fmin, fmax in FREQ_BANDS.values():
        psds_band = psds[:, :, (freqs >= fmin) & (freqs < fmax)].mean(axis=-1)
        X.append(psds_band.reshape(len(psds), -1))

    return np.concatenate(X, axis=1)
Multiclass classification workflow using scikit-learn#
To answer the question of how well can we predict the sleep stages of Bob from Alice’s data and avoid as much boilerplate code as possible, we will take advantage of two key features of sckit-learn: Pipeline , and FunctionTransformer.
Scikit-learn pipeline composes an estimator as a sequence of transforms
and a final estimator, while the FunctionTransformer converts a python
function in an estimator compatible object. In this manner we can create
scikit-learn estimator that takes mne.Epochs thanks to
eeg_power_band function we just created.
pipe = make_pipeline(
    FunctionTransformer(eeg_power_band, validate=False),
    RandomForestClassifier(n_estimators=100, random_state=42),
)

# Train
y_train = epochs_train.events[:, 2]
pipe.fit(epochs_train, y_train)

# Test
y_pred = pipe.predict(epochs_test)

# Assess the results
y_test = epochs_test.events[:, 2]
acc = accuracy_score(y_test, y_pred)

print(f"Accuracy score: {acc}")
Using data from preloaded Raw for 841 events and 3000 original time points ...
0 bad epochs dropped
    Using multitaper spectrum estimation with 7 DPSS windows
Using data from preloaded Raw for 1103 events and 3000 original time points ...
0 bad epochs dropped
    Using multitaper spectrum estimation with 7 DPSS windows
Accuracy score: 0.6854034451495921
In short, yes. We can predict Bob’s sleeping stages based on Alice’s data.
Further analysis of the data#
We can check the confusion matrix or the classification report.
print(confusion_matrix(y_test, y_pred))
[[154   1   0   2   0]
 [ 71  25   8   1   4]
 [ 47  33 437  25  20]
 [  0   0   4 101   0]
 [ 51  63  17   0  39]]
print(classification_report(y_test, y_pred, target_names=event_id.keys()))
                 precision    recall  f1-score   support

  Sleep stage W       0.48      0.98      0.64       157
  Sleep stage 1       0.20      0.23      0.22       109
  Sleep stage 2       0.94      0.78      0.85       562
Sleep stage 3/4       0.78      0.96      0.86       105
  Sleep stage R       0.62      0.23      0.33       170

       accuracy                           0.69      1103
      macro avg       0.60      0.64      0.58      1103
   weighted avg       0.74      0.69      0.68      1103
Exercise#
Fetch 50 subjects from the Physionet database and run a 5-fold cross-validation leaving each time 10 subjects out in the test set.
References#
Total running time of the script: (0 minutes 18.880 seconds)