Note
Go to the end to download the full example code.
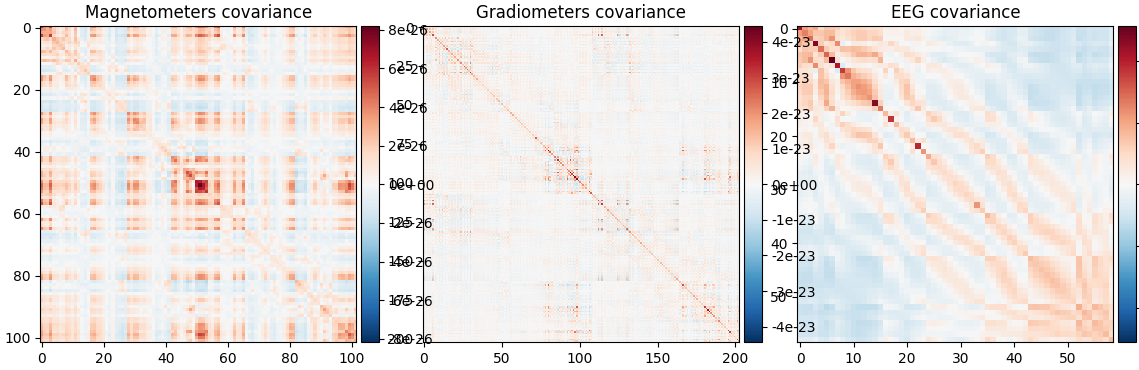
Reading/Writing a noise covariance matrix#
How to plot a noise covariance matrix.
# Author: Alexandre Gramfort <alexandre.gramfort@inria.fr>
#
# License: BSD-3-Clause
# Copyright the MNE-Python contributors.
import mne
from mne.datasets import sample

data_path = sample.data_path()
fname_cov = data_path / "MEG" / "sample" / "sample_audvis-cov.fif"
fname_evo = data_path / "MEG" / "sample" / "sample_audvis-ave.fif"

cov = mne.read_cov(fname_cov)
print(cov)
ev_info = mne.io.read_info(fname_evo)
    366 x 366 full covariance (kind = 1) found.
    Read a total of 4 projection items:
        PCA-v1 (1 x 10²) active
        PCA-v2 (1 x 10²) active
        PCA-v3 (1 x 10²) active
        Average EEG reference (1 x 60) active
<Covariance | kind : full, shape : (366, 366), range : [-1.3e-11, +5.1e-11], n_samples : 15972>
    Read a total of 4 projection items:
        PCA-v1 (1 x 10²) active
        PCA-v2 (1 x 10²) active
        PCA-v3 (1 x 10²) active
        Average EEG reference (1 x 60) active
Plot covariance
Total running time of the script: (0 minutes 1.668 seconds)