Note
Go to the end to download the full example code.
Visualise NIRS artifact correction methods#
Here we artificially introduce several fNIRS artifacts and observe how artifact correction techniques attempt to correct the data.
# Authors: Robert Luke <mail@robertluke.net>
#
# License: BSD-3-Clause
# Copyright the MNE-Python contributors.
import os

import mne
from mne.preprocessing.nirs import (
    optical_density,
    temporal_derivative_distribution_repair,
)
Import data#
Here we will work with the fNIRS motor data. We resample the data to make indexing exact times more convenient. We then convert the data to optical density to perform corrections on and plot these signals.
fnirs_data_folder = mne.datasets.fnirs_motor.data_path()
fnirs_cw_amplitude_dir = os.path.join(fnirs_data_folder, "Participant-1")
raw_intensity = mne.io.read_raw_nirx(fnirs_cw_amplitude_dir, verbose=True)
raw_intensity.load_data().resample(3, npad="auto")
raw_od = optical_density(raw_intensity)
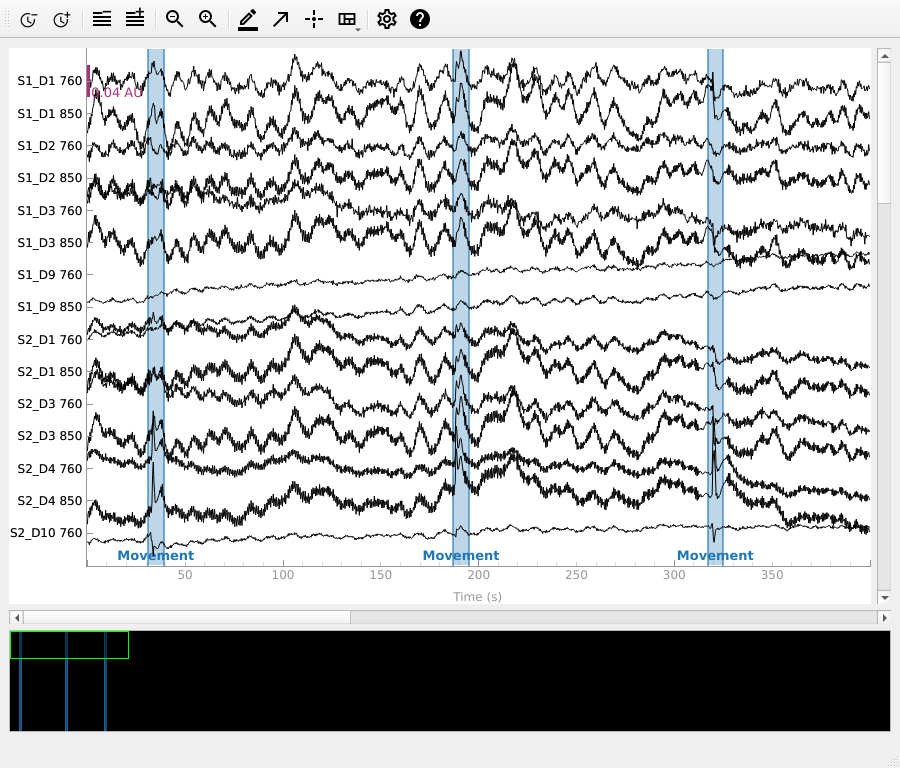
new_annotations = mne.Annotations(
[31, 187, 317], [8, 8, 8], ["Movement", "Movement", "Movement"]
)
raw_od.set_annotations(new_annotations)
raw_od.plot(n_channels=15, duration=400, show_scrollbars=False)
Loading /home/circleci/mne_data/MNE-fNIRS-motor-data/Participant-1
Reading 0 ... 23238  =      0.000 ...  2974.464 secs...
We can see some small artifacts in the above data from movement around 40, 190 and 240 seconds. However, this data is relatively clean so we will add some additional artifacts below.
Add artificial artifacts to data#
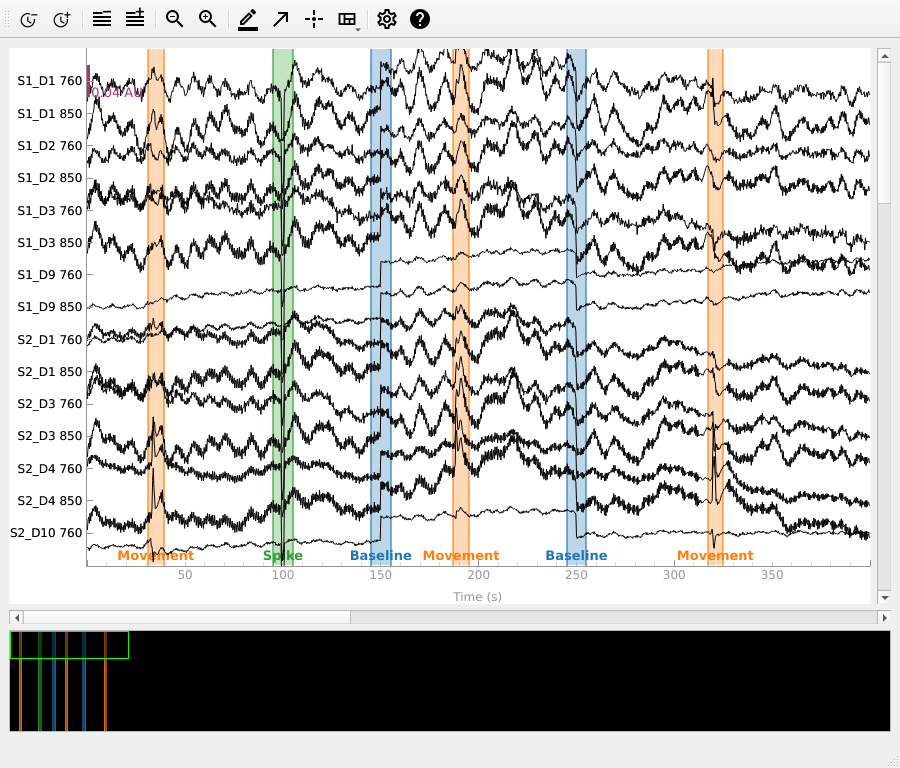
Two common types of artifacts in NIRS data are spikes and baseline shifts. Spikes often occur when a person moves and the optode moves relative to the scalp and then returns to its original position. Baseline shifts occur if the optode moves relative to the scalp and does not return to its original position. We add a spike type artifact at 100 seconds and a baseline shift at 200 seconds to the data.
corrupted_data = raw_od.get_data()
corrupted_data[:, 298:302] = corrupted_data[:, 298:302] - 0.06
corrupted_data[:, 450:750] = corrupted_data[:, 450:750] + 0.03
corrupted_od = mne.io.RawArray(
    corrupted_data, raw_od.info, first_samp=raw_od.first_samp
)
new_annotations.append([95, 145, 245], [10, 10, 10], ["Spike", "Baseline", "Baseline"])
corrupted_od.set_annotations(new_annotations)

corrupted_od.plot(n_channels=15, duration=400, show_scrollbars=False)
Creating RawArray with float64 data, n_channels=56, n_times=8924
    Range : 0 ... 8923 =      0.000 ...  2974.333 secs
Ready.
Apply temporal derivative distribution repair#
This approach corrects baseline shift and spike artifacts without the need for any user-supplied parameters [1].
corrected_tddr = temporal_derivative_distribution_repair(corrupted_od)
corrected_tddr.plot(n_channels=15, duration=400, show_scrollbars=False)
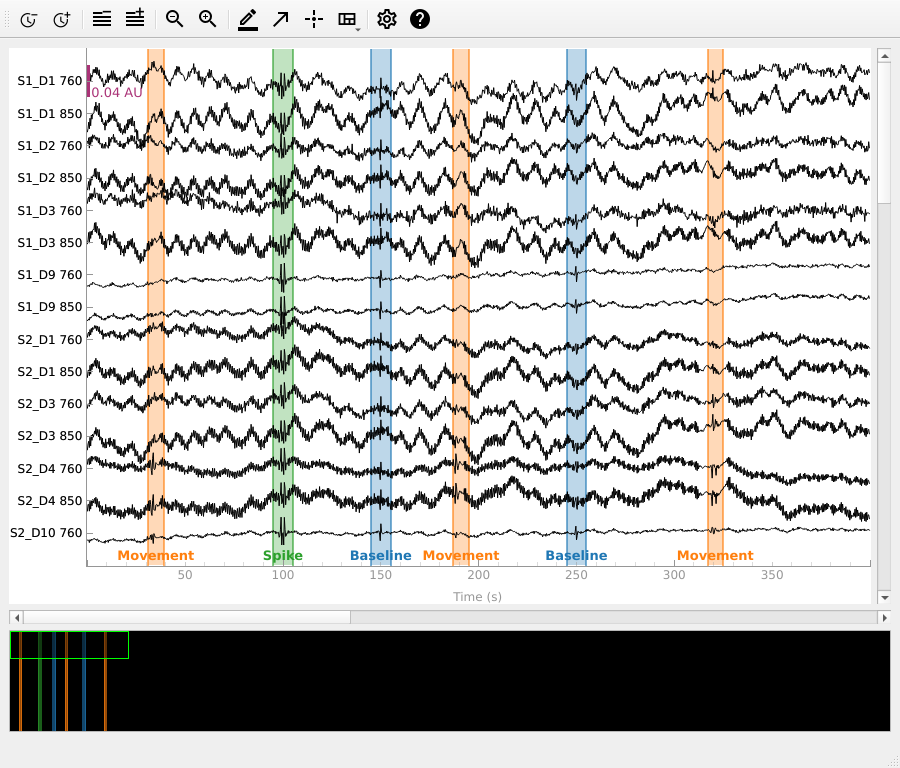
We can see in the data above that the introduced spikes and shifts are largely removed, but some residual smaller artifact remains. The same can be said for the artifacts in the original data.
References#
Total running time of the script: (0 minutes 3.004 seconds)