Note
Go to the end to download the full example code.
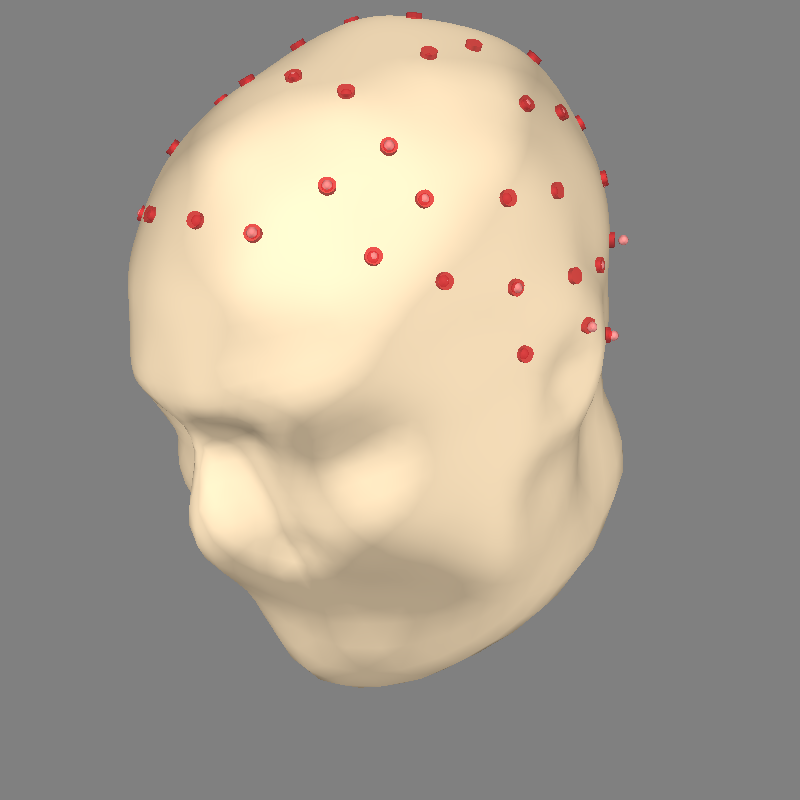
Plotting EEG sensors on the scalp#
In this example, digitized EEG sensor locations are shown on the scalp surface.
# Author: Eric Larson <larson.eric.d@gmail.com>
#
# License: BSD-3-Clause
# Copyright the MNE-Python contributors.
import mne
from mne.viz import plot_alignment, set_3d_view

print(__doc__)

data_path = mne.datasets.sample.data_path()
subjects_dir = data_path / "subjects"
meg_path = data_path / "MEG" / "sample"
trans = mne.read_trans(meg_path / "sample_audvis_raw-trans.fif")
raw = mne.io.read_raw_fif(meg_path / "sample_audvis_raw.fif")

# Plot electrode locations on scalp
fig = plot_alignment(
    raw.info,
    trans,
    subject="sample",
    dig=False,
    eeg=["original", "projected"],
    meg=[],
    coord_frame="head",
    subjects_dir=subjects_dir,
    show_channel_names=True,
)

# Set viewing angle
set_3d_view(figure=fig, azimuth=135, elevation=80)
Opening raw data file /home/circleci/mne_data/MNE-sample-data/MEG/sample/sample_audvis_raw.fif...
    Read a total of 3 projection items:
        PCA-v1 (1 x 10²)  idle
        PCA-v2 (1 x 10²)  idle
        PCA-v3 (1 x 10²)  idle
    Range : 25800 ... 192599 =     42.956 ...   320.670 secs
Ready.
Using outer_skin.surf for head surface.
Channel types:: eeg: 59
Projecting sensors to the head surface
Total running time of the script: (0 minutes 5.583 seconds)