Note
Go to the end to download the full example code.
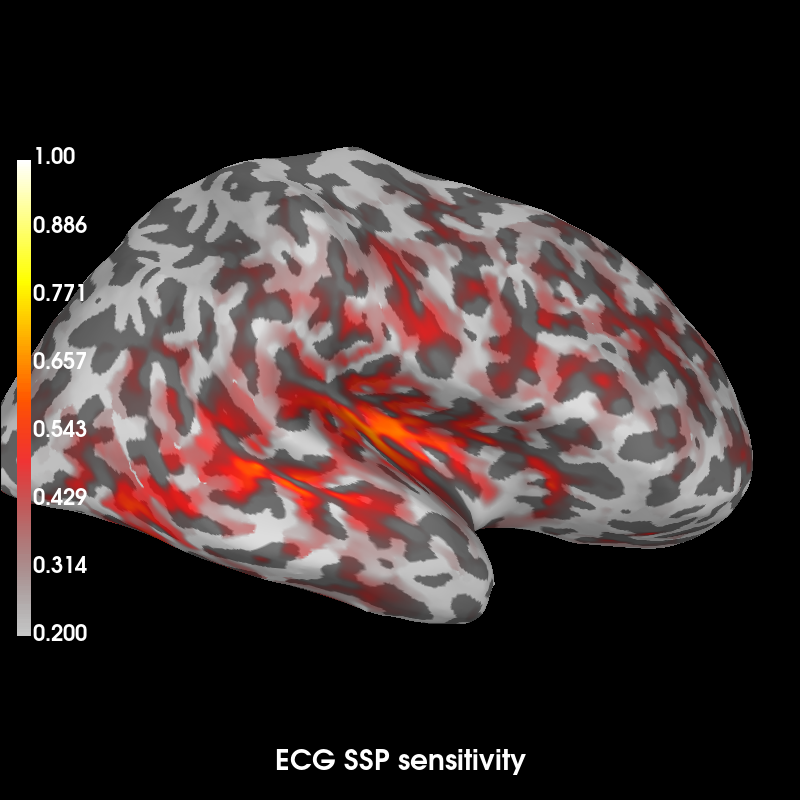
Sensitivity map of SSP projections#
This example shows the sources that have a forward field similar to the first SSP vector correcting for ECG.
# Author: Alexandre Gramfort <alexandre.gramfort@inria.fr>
#
# License: BSD-3-Clause
# Copyright the MNE-Python contributors.
import matplotlib.pyplot as plt

from mne import read_forward_solution, read_proj, sensitivity_map
from mne.datasets import sample

print(__doc__)

data_path = sample.data_path()

subjects_dir = data_path / "subjects"
meg_path = data_path / "MEG" / "sample"
fname = meg_path / "sample_audvis-meg-eeg-oct-6-fwd.fif"
ecg_fname = meg_path / "sample_audvis_ecg-proj.fif"

fwd = read_forward_solution(fname)

projs = read_proj(ecg_fname)
# take only one projection per channel type
projs = projs[::2]

# Compute sensitivity map
ssp_ecg_map = sensitivity_map(fwd, ch_type="grad", projs=projs, mode="angle")
Reading forward solution from /home/circleci/mne_data/MNE-sample-data/MEG/sample/sample_audvis-meg-eeg-oct-6-fwd.fif...
    Reading a source space...
    Computing patch statistics...
    Patch information added...
    Distance information added...
    [done]
    Reading a source space...
    Computing patch statistics...
    Patch information added...
    Distance information added...
    [done]
    2 source spaces read
    Desired named matrix (kind = 3523 (FIFF_MNE_FORWARD_SOLUTION_GRAD)) not available
    Read MEG forward solution (7498 sources, 306 channels, free orientations)
    Desired named matrix (kind = 3523 (FIFF_MNE_FORWARD_SOLUTION_GRAD)) not available
    Read EEG forward solution (7498 sources, 60 channels, free orientations)
    Forward solutions combined: MEG, EEG
    Source spaces transformed to the forward solution coordinate frame
    Read a total of 6 projection items:
        ECG-planar-999--0.200-0.400-PCA-01 (1 x 203)  idle
        ECG-planar-999--0.200-0.400-PCA-02 (1 x 203)  idle
        ECG-axial-999--0.200-0.400-PCA-01 (1 x 10²)  idle
        ECG-axial-999--0.200-0.400-PCA-02 (1 x 10²)  idle
        ECG-eeg-999--0.200-0.400-PCA-01 (1 x 59)  idle
        ECG-eeg-999--0.200-0.400-PCA-02 (1 x 59)  idle
    204 out of 366 channels remain after picking
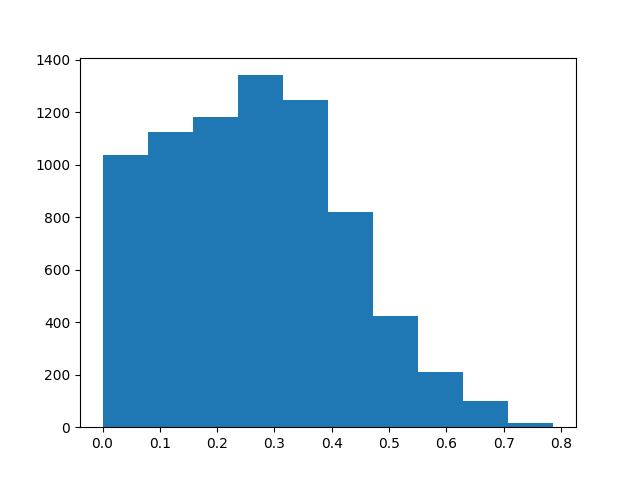
Show sensitivity map
plt.hist(ssp_ecg_map.data.ravel())
plt.show()

args = dict(
    clim=dict(kind="value", lims=(0.2, 0.6, 1.0)),
    smoothing_steps=7,
    hemi="rh",
    subjects_dir=subjects_dir,
)
ssp_ecg_map.plot(subject="sample", time_label="ECG SSP sensitivity", **args)
Total running time of the script: (0 minutes 4.470 seconds)