Visualization#
Looking at data and processing output.
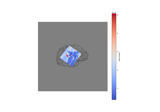
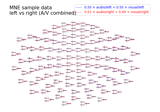
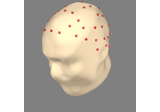
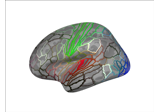
How to convert 3D electrode positions to a 2D image
How to convert 3D electrode positions to a 2D image


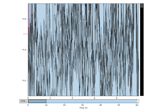
Advanced plotting customization by subclassing MNEBrowseFigure
Advanced plotting customization by subclassing MNEBrowseFigure
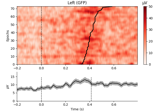
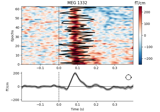
Plot single trial activity, grouped by ROI and sorted by RT
Plot single trial activity, grouped by ROI and sorted by RT