Note
Go to the end to download the full example code.
Exploring epoch quality before rejection#
This example shows an approach for identifying epochs containing potential artifacts and rejecting these bad epochs. We compute per-epoch outlier scores using peak-to-peak amplitude, variance, and kurtosis — inspired by FASTER [1] and Delorme et al.[2] — and use them to rank epochs from cleanest to noisiest to inform rejection decisions.
# Authors: Aman Srivastava
#
# License: BSD-3-Clause
# Copyright the MNE-Python contributors.
import matplotlib.pyplot as plt
import numpy as np
from scipy.stats import kurtosis

import mne
from mne.datasets import eegbci

print(__doc__)
Load the EEGBCI dataset and create epochs#
raw_fname = eegbci.load_data(subjects=3, runs=(3,))[0]
raw = mne.io.read_raw(raw_fname, preload=True)
eegbci.standardize(raw)
montage = mne.channels.make_standard_montage("spherical_1005")
raw.set_montage(montage)

events, event_id = mne.events_from_annotations(raw)
epochs = mne.Epochs(raw, events, tmin=-0.2, tmax=0.5, preload=True, baseline=(None, 0))
Extracting EDF parameters from /home/circleci/mne_data/MNE-eegbci-data/files/eegmmidb/1.0.0/S003/S003R03.edf...
Setting channel info structure...
Creating raw.info structure...
Reading 0 ... 19999  =      0.000 ...   124.994 secs...
Used Annotations descriptions: [np.str_('T0'), np.str_('T1'), np.str_('T2')]
Not setting metadata
30 matching events found
Setting baseline interval to [-0.2, 0.0] s
Applying baseline correction (mode: mean)
0 projection items activated
Using data from preloaded Raw for 30 events and 113 original time points ...
1 bad epochs dropped
Compute per-epoch outlier scores#
Peak-to-peak amplitude, variance, and kurtosis are computed per epoch. Each feature is z-scored robustly using median absolute deviation across epochs, and averaged into a single outlier score normalised between [0, 1]. Scores close to 1 indicate a likely presence of artifacts in the epoch.
data = epochs.get_data()  # (n_epochs, n_channels, n_times)

ptp = np.ptp(data, axis=-1).mean(axis=-1)
var = data.var(axis=-1).mean(axis=-1)
kurt = np.array([kurtosis(data[i].ravel()) for i in range(len(data))])

features = np.column_stack([ptp, var, kurt])
median = np.median(features, axis=0)
mad = np.median(np.abs(features - median), axis=0) + 1e-10
z = np.abs((features - median) / mad)

raw_score = z.mean(axis=-1)
scores = (raw_score - raw_score.min()) / (raw_score.max() - raw_score.min() + 1e-10)
Determining outlier epochs#
Below, epochs are ranked from cleanest to noisiest. We need to find an appropriate threshold to flag those epochs likely containing artifacts. The threshold to use will vary depending on the dataset and analysis goals. In the plot, we show two example thresholds: a more lenient threshold of 0.6; and a stricter threshold of 0.3.
fig, ax = plt.subplots(layout="constrained")
sorted_idx = np.argsort(scores)
ax.bar(np.arange(len(scores)), scores[sorted_idx], color="steelblue")
ax.axhline(0.6, color="red", linestyle="--", label="More lenient threshold (0.6)")
ax.axhline(0.3, color="orange", linestyle="--", label="Stricter threshold (0.3)")
ax.set(
    xlabel="Epoch (sorted by score)",
    ylabel="Outlier score",
    title="Epoch quality scores (0 = clean, 1 = likely artifact)",
)
ax.legend()

for threshold in [0.6, 0.3]:
    bad_epochs = np.where(scores > threshold)[0]
    print(
        f"Threshold {threshold}: {len(bad_epochs)} epochs flagged "
        f"out of {len(epochs)} total"
    )

Threshold 0.6: 5 epochs flagged out of 29 total
Threshold 0.3: 7 epochs flagged out of 29 total
Epochs flagged by the thresholds can be inspected using the mne.Epochs.plot()
method. This is a crucial step in identifying the optimal threshold. First, we show
those epochs with the worst scores (≥ 0.6), containing a number of amplitude spikes.
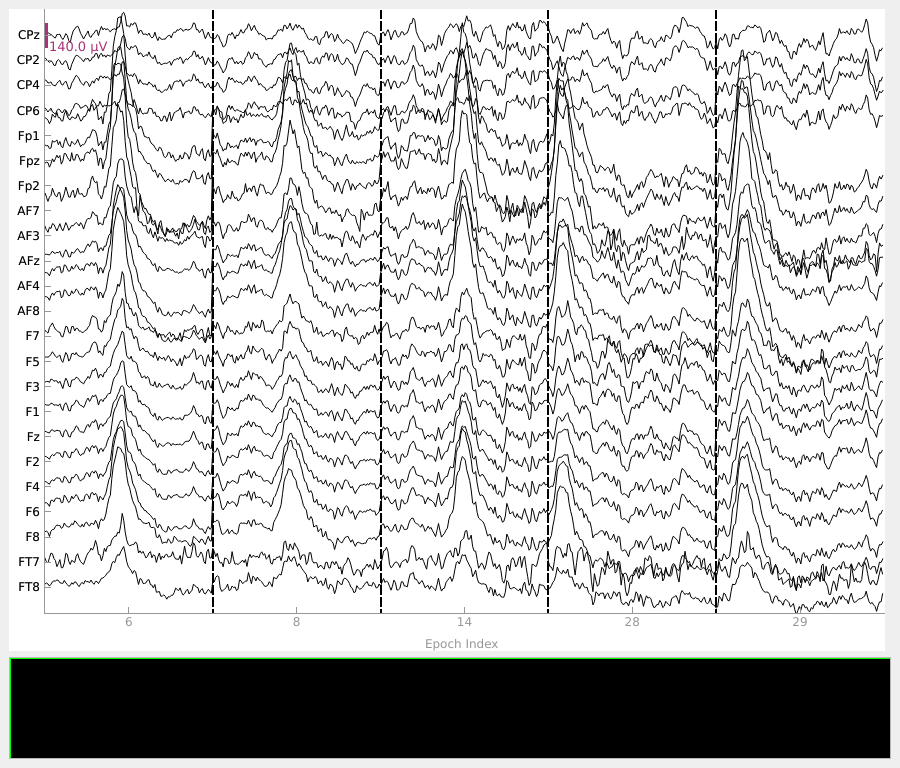
Using qt as 2D backend.
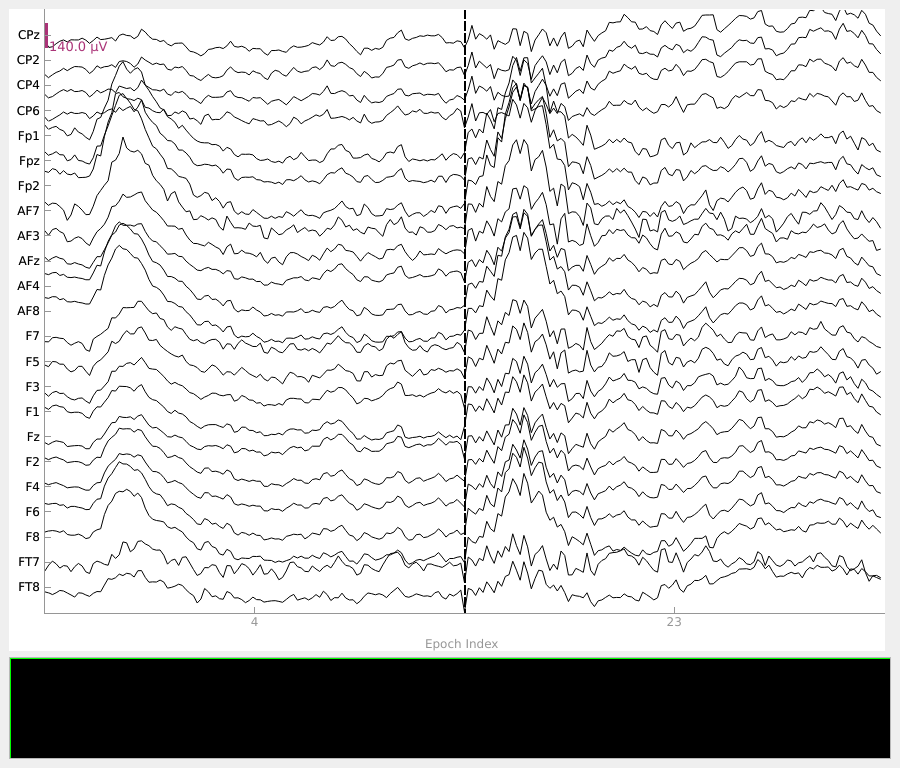
In contrast, the threshold of 0.3 captures epochs with less severe artifact activity, which may be overly conservative to exclude from the analysis.
Dropping suspicious epochs#
Following visual inspection, bad epochs can be discarded using the
mne.Epochs.drop() method. Here, we remove the worst scoring epochs (≥ 0.6)
which contained strong artifact activity. The remaining good epochs can then be used
for further analysis.
Repairing and retaining epochs with artifacts
In this case, the large frontal deflections are likely blink artifacts, so dropping is not the only option. For artifacts like these, it can be preferable to repair the data and keep more epochs, for example with ICA or regression-based artifact correction.
epochs.drop(np.where(scores >= 0.6)[0])
print(f"Epochs remaining after dropping scores ≥ 0.6: {len(epochs)}")
Dropped 5 epochs: 5, 7, 13, 27, 28
Epochs remaining after dropping scores ≥ 0.6: 24
References#
Total running time of the script: (0 minutes 1.665 seconds)