Note
Go to the end to download the full example code.
Integrating with R via rpy2#
This example shows how to run a mass-univariate 2-sample t-test on
Epochs data in Python using scipy.stats.ttest_ind(),
then run the equivalent test in R via rpy2,
and confirm that both approaches give identical results.
rpy2 is probably most useful for leveraging statistical functionality in R
that is unavailable (or hard to use) in Python, but in principle it can be
used for anything the R ecosystem has to offer.
Note
This example requires rpy2 to be installed (pip install rpy2)
and a working R installation with the stats package (included by
default in R).
# Authors: The MNE-Python contributors.
# License: BSD-3-Clause
# Copyright the MNE-Python contributors.
Load sample data and create Epochs#
We use the MNE sample dataset and create epochs for two conditions: auditory/left and auditory/right.
import numpy as np
import rpy2.robjects as ro
from rpy2.robjects import default_converter, numpy2ri
from rpy2.robjects.conversion import localconverter
from scipy import stats

import mne

data_path = mne.datasets.sample.data_path()
raw_fname = data_path / "MEG" / "sample" / "sample_audvis_filt-0-40_raw.fif"
event_fname = data_path / "MEG" / "sample" / "sample_audvis_filt-0-40_raw-eve.fif"

raw = mne.io.read_raw_fif(raw_fname, preload=True)
events = mne.read_events(event_fname)

event_id = {"auditory/left": 1, "auditory/right": 2}
tmin, tmax = -0.2, 0.5

epochs = mne.Epochs(
    raw,
    events,
    event_id=event_id,
    tmin=tmin,
    tmax=tmax,
    baseline=(None, 0),
    preload=True,
)
Opening raw data file /home/circleci/mne_data/MNE-sample-data/MEG/sample/sample_audvis_filt-0-40_raw.fif...
    Read a total of 4 projection items:
        PCA-v1 (1 x 10²)  idle
        PCA-v2 (1 x 10²)  idle
        PCA-v3 (1 x 10²)  idle
        Average EEG reference (1 x 60)  idle
    Range : 6450 ... 48149 =     42.956 ...   320.665 secs
Ready.
Reading 0 ... 41699  =      0.000 ...   277.709 secs...
Not setting metadata
145 matching events found
Setting baseline interval to [-0.19979521315838786, 0.0] s
Applying baseline correction (mode: mean)
Created an SSP operator (subspace dimension = 4)
4 projection items activated
Using data from preloaded Raw for 145 events and 106 original time points ...
0 bad epochs dropped
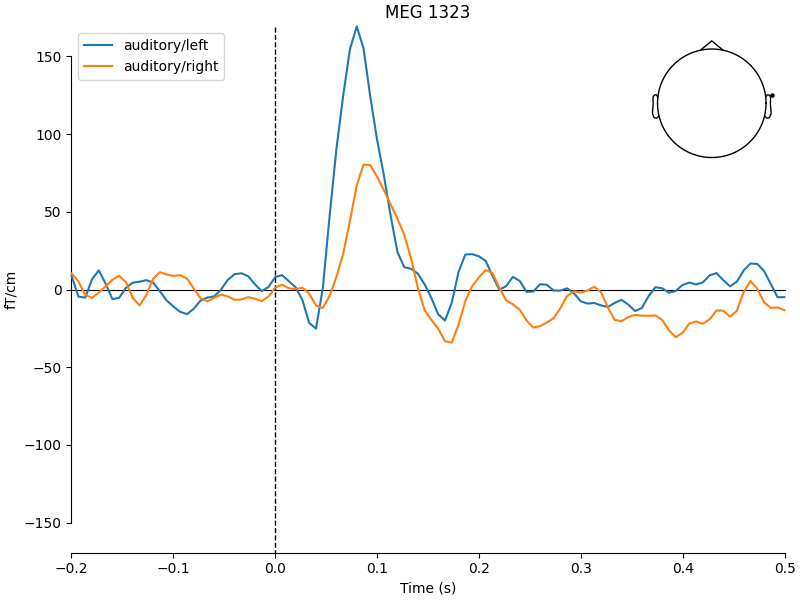
Visualize the evoked responses#
We first plot the evoked responses to motivate the statistical test. Auditory left vs right stimuli should differ over lateral temporal sensors.
evoked_left = epochs["auditory/left"].average()
evoked_right = epochs["auditory/right"].average()

mne.viz.plot_compare_evokeds(
    {"auditory/left": evoked_left, "auditory/right": evoked_right},
    picks="MEG 1323",
)
Extract ROI data and run t-test in Python#
We pick a few lateral temporal sensors as our ROI and average over them and a typical N1 time window (80–120 ms). This gives one value per epoch, which is a plausible neuroscience analysis.
roi_channels = ["MEG 1323"]
tmin_roi, tmax_roi = 0.08, 0.12

epochs.crop(tmin_roi, tmax_roi).pick(roi_channels)
epochs_left = epochs["auditory/left"].get_data().mean(axis=(1, 2))
epochs_right = epochs["auditory/right"].get_data().mean(axis=(1, 2))

t_python, p_python = stats.ttest_ind(epochs_left, epochs_right)
print(f"Python  →  t = {t_python:.4f},  p = {p_python:.4f}")
Python → t = 2.6196, p = 0.0098
Run the same t-test in R via rpy2#
We pass the same NumPy arrays to R using rpy2 and call R’s built-in
t.test(). A few things to note about the rpy2 API:
Accessing R functions:
rpy2.robjects (imported as ro) has an attribute r that acts as
a proxy to the R global namespace. You can access any R function by name
using a dictionary-like interface, e.g. ro.r["t.test"] retrieves R’s
t.test function as a callable Python object.
Converting NumPy arrays to R vectors:
R functions expect R objects as input, not raw NumPy arrays.
rpy2.robjects.FloatVector converts a 1-D NumPy array of floats
into an R numeric vector. The localconverter context manager
together with numpy2ri.converter handles the conversion
automatically inside the with block.
Passing arguments with dots in their names:
Unlike Python, R allows function parameter names to contain ., such as
var.equal. Since var.equal is not a valid Python keyword argument
name, you must pass it inside a dictionary and unpack it with **.
Extracting results from R objects:
R’s t.test() returns a list-like object. The rx2 method extracts
a named element from it - this is equivalent to the $ operator in R
(e.g. result$statistic). The extracted value is still an R vector, so
we index with [0] to get the first (and only) element as a Python scalar,
and wrap it in float() to ensure it is a plain Python float.
with localconverter(default_converter + numpy2ri.converter):
    r_left = ro.FloatVector(epochs_left)
    r_right = ro.FloatVector(epochs_right)

r_ttest = ro.r["t.test"]
result = r_ttest(r_left, r_right, **{"var.equal": True})

t_r = float(result.rx2("statistic")[0])
p_r = float(result.rx2("p.value")[0])
print(f"R       →  t = {t_r:.4f},  p = {p_r:.4f}")
R → t = 2.6196, p = 0.0098
Compare results#
Both approaches give identical t and p values (up to floating point precision), confirming that R and Python produce equivalent results.
t difference: 0.00e+00
p difference: 1.73e-18
Total running time of the script: (0 minutes 2.596 seconds)